Simulate spatial point process
simul_spat.RdGenerates a spatial point process from a reference map, using Inhomogeneous Poisson Point Process with spatstat IPP. The intensity of the process is proportional to this reference map, and the final number of individuals in the population is provided by N. Several runs can be simulated at the same time. If working in a real environment, reference map must be projected.
Usage
simul_spat(
  ref_map,
  N,
  seed = NULL,
  n_sim = 1,
  return_wgs_coordinates = TRUE,
  drop_geometry = FALSE,
  mean_group_size = NULL
)
Arguments
- ref_map
Reference map, must be projected
- N
Number of individuals in the final population
- seed
Numeric
- n_sim
Number of simulation to run
- return_wgs_coordinates
Boolean. Should the function returns points in WGS coordinates? Recommended when working on real environment
- drop_geometry
Boolean. Should the geometry be dropped in returned object? Defaults to FALSE, if TRUE the function will return a data.frame and not a sf object.
- mean_group_size
The mean group size to generate the mark. Set to NULL if no mark is wanted.
Examples
grid <- create_grid()
cdt <- generate_env_layer(grid = grid)
#> [using unconditional Gaussian simulation]
rsce <- generate_resource_layer(env_layers = cdt$rasters,
beta = c(2, -1.5))
# issue a warning: we are in a virtual env and ref_map has no crs
out <- simul_spat(ref_map = rsce$rasters, n_sim = 2,
return_wgs_coordinates = FALSE, N = 1000, mean_group_size = 10)
#> Warning: ref_map has no crs, is that voluntary? The output will have no crs.
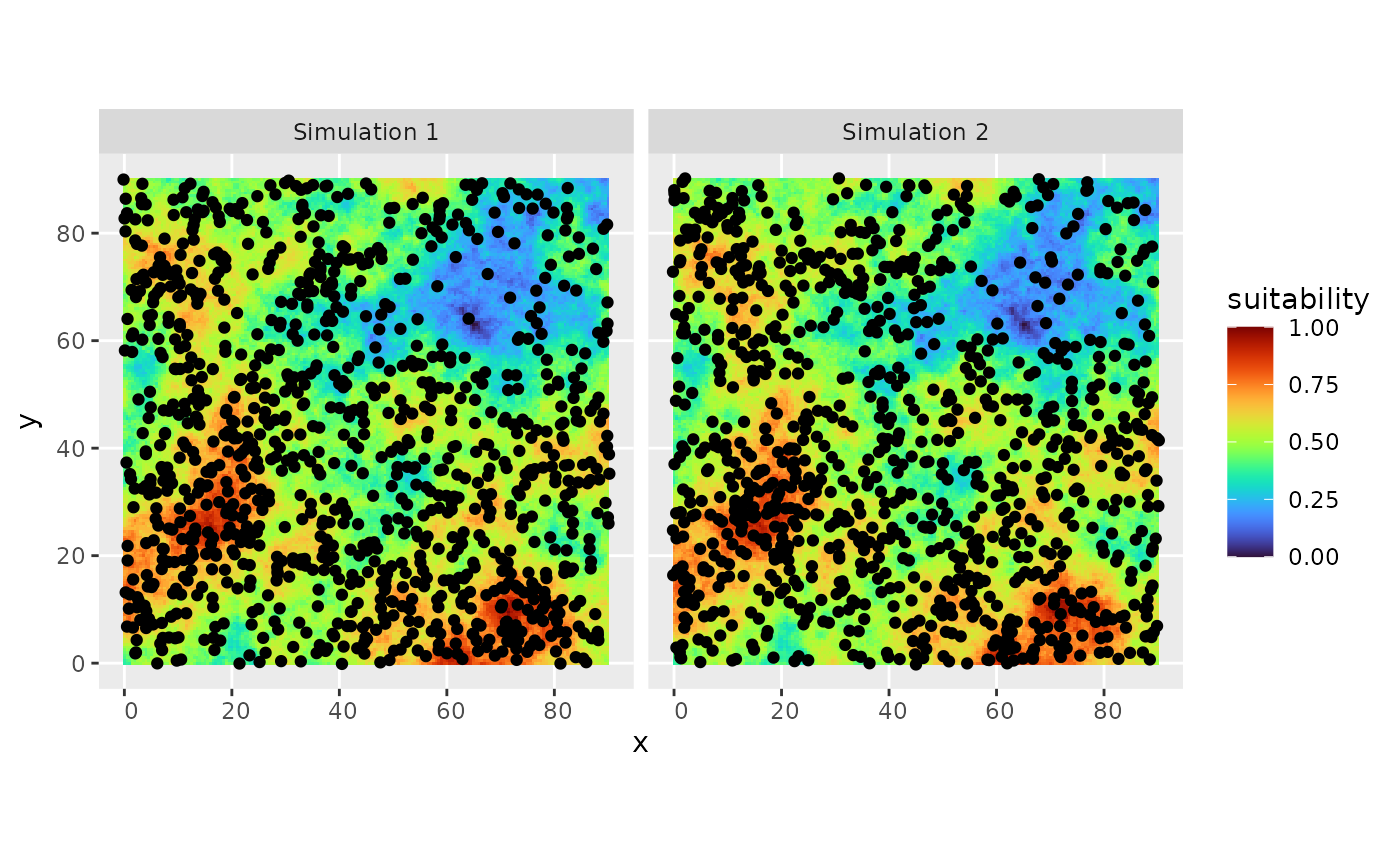
# plot the simulated distribution
ggplot2::ggplot(out) +
ggplot2::geom_tile(data = rsce$dataframe, ggplot2::aes(x = x, y = y, fill = suitability)) +
ggplot2::geom_sf() + ggplot2::facet_wrap("name") +
viridis::scale_fill_viridis(option = "H")
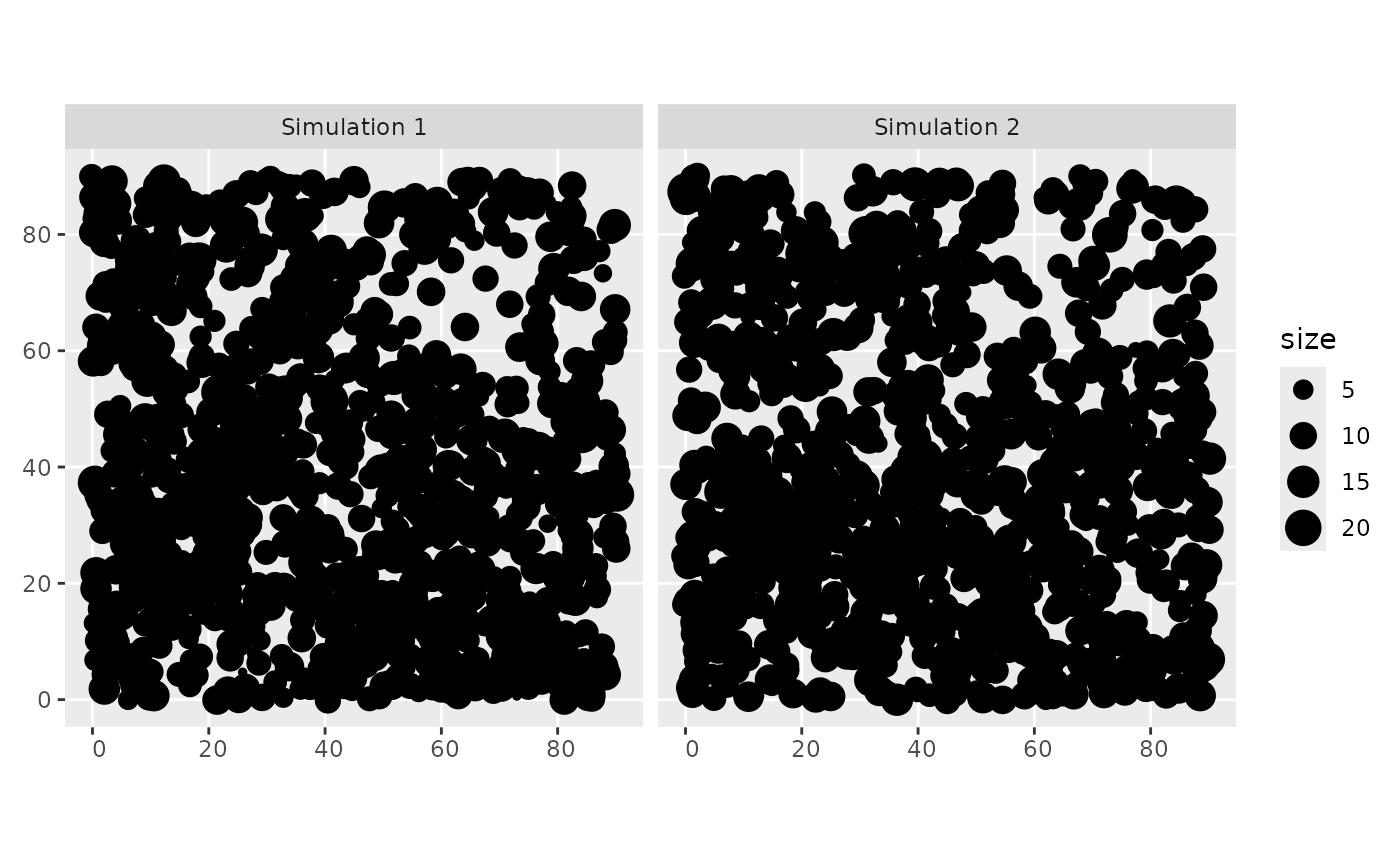
 # check the generated group size
ggplot2::ggplot(out) +
ggplot2::geom_sf(ggplot2::aes(size = size)) + ggplot2::facet_wrap("name")
# check the generated group size
ggplot2::ggplot(out) +
ggplot2::geom_sf(ggplot2::aes(size = size)) + ggplot2::facet_wrap("name")